Solar, wind and batteries have seen dramatic gains in competitiveness over the last six months compared to longer-established energy options. Their scale-up is putting existing coal and gas at risk, according to the latest global figures for generation and storage.
The upshot is that solar PV and onshore wind are now the cheapest sources of new-build generation for at least two-thirds of the global population. Those two-thirds live in locations that comprise 71% of gross domestic product and 85% of energy generation. Battery storage is also now the cheapest new-build technology for peaking purposes (up to two-hours of discharge duration) in gas-importing regions, such as Europe, China or Japan.
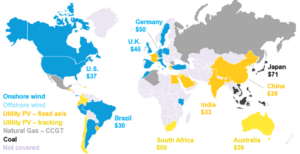
The latest analysis by research company BloombergNEF (BNEF) shows that the global benchmark levelised cost of electricity, or LCOE, for onshore wind and utility-scale PV, has fallen 9% and 4% since the second half of 2019 — to $44 and $50/MWh, respectively. Meanwhile, the benchmark LCOE for battery storage has tumbled to $150/MWh, about half of what it was two years ago.
Onshore wind has seen its most significant drop in cost since 2015. This is mainly due to a scale-up in turbine size, now averaging 4.1MW, and priced at about $0.7M/MW for recently financed projects. In Brazil for instance, where wind resources are ample, the economic crisis of 2016 onwards saw the cost of capital for projects increase by up to 13%.
BNEF analysis suggests that lending rates more recently have fallen back to levels seen before that crisis. This means best-in-class onshore wind projects can achieve an LCOE of $24/MWh, the lowest globally. Meanwhile, top projects in the US, India and Spain follow at $26, $29 and $29/MWh respectively, excluding subsidies such as tax-credits.
In China, the largest PV market, the solar benchmark is at $38/MWh, down 9% from the second half of 2019, following a rapid uptake in better-performing monocrystalline modules. New-build solar in the country is now almost on par with the running cost of coal-fired power plants, at an average of $35/MWh. This is significant, as China advances on its deregulation agenda, opening up competition in the power sector.
Globally, BNEF estimates that some of the cheapest PV projects financed in the last six months will be able to achieve an LCOE of $23-29/MWh, assuming competitive returns to their equity investors. Those projects can be found in Australia, China, Chile, and the UAE, where they will challenge the existing fleet of fossil fuel power plants.
Commenting on prices tumbling, lead author of the report at BNEF, Tifenn Brandily said:
“There have been dramatic improvements in the cost-competitiveness of solar and wind. Part of it is due to photovoltaic and wind technology getting better at extracting renewable resources. But our analysis also suggests that since 2016, auctions are forcing developers to realise cost savings by scaling-up project size and portfolios. Larger scale enables them to slash balance-of-plant, operations and maintenance expenses — and have a stronger negotiating position when ordering equipment.”
Globally, BNEF estimates that the average onshore wind farm has doubled its capacity from 32MW in 2016 to about 73MW today. Solar farms are a third more powerful today, at 27MW on average, compared to 2016.
Looking ahead at pricing forecasts, Brandily added:
“On current trends, the LCOE of best-in-class solar and wind projects will be pushing below $20/MWh this side of 2030. A decade ago, solar generation costs were well above $300, while onshore wind power hovered above $100/MWh. Today the best solar projects in Chile, the Middle-East and China, or wind projects in Brazil, the US and India, can achieve less than $30/MWh. And there are plenty of innovations in the pipeline that will drive down costs further.”
Battery storage is another example of how scale can unlock cost reductions. Today, BNEF estimates that the average capacity of storage projects sits at about 30MWh, a fourfold rise compared to just 7MWh per project four years ago. Since 2018, increasing project sizes combined with a rapidly expanding manufacturing base and more energy-dense chemistries, have halved the LCOE of energy storage. The BNEF global LCOE benchmark sits now at $150/MWh for battery storage systems with a four-hour duration.
China is home to the cheapest storage levelised costs globally, at $115/MWh. This competitive advantage hinges mainly on the proximity of developers to the equipment supply chain and the more widespread use of cheaper LFP (lithium iron phosphate) chemistries. In comparison, the levelised cost of open-cycle gas turbines per megawatt-hour sits today between $99 in the US and $235 in Japan, with China at $145/MWh.
BNEF’s LCOE analysis is based on information on real projects starting construction, and proprietary pricing information from suppliers. Its database covers nearly 7,000 projects across 25 technologies (including the various types of coal, gas and nuclear generation as well as renewables), situated in 47 countries around the world. The data used for the latest report come from actual deals over recent months, and therefore do not reflect what may happen to the LCOEs as a result of the economic shock created by the coronavirus pandemic.
The implications of COVID-19 could be multiple and various, concluded chief economist at BNEF Seb Henbest:
“The coronavirus will have a range of impacts on the relative cost of fossil and renewable electricity. One important question is what happens to the costs of finance over the short and medium term. Another concerns commodity prices — coal and gas prices have weakened on world markets. If sustained, this could help shield fossil-fuel generation for a while from the cost onslaught from renewables.”
With a team of experts spread across six continents, BloombergNEF (BNEF) is a leading provider of primary research on clean energy, advanced transport, digital industry, innovative materials, and commodities. BNEF is powered by Bloomberg’s global network of 19,000 employees in 176 locations, reporting 5,000 news stories a day.
* Image source: BloombergNEF. Note: LCOE calculations exclude subsidies or tax-credits. Graph shows benchmark LCOE for each country in $ per MWh. CCGT: Combined-cycle gas turbine.
Further Reading:
- More about BloombergNEF (BNEF).
Check out the full archive of stories on the SustMeme Climate & Energy Channel, now available to Sponsor.